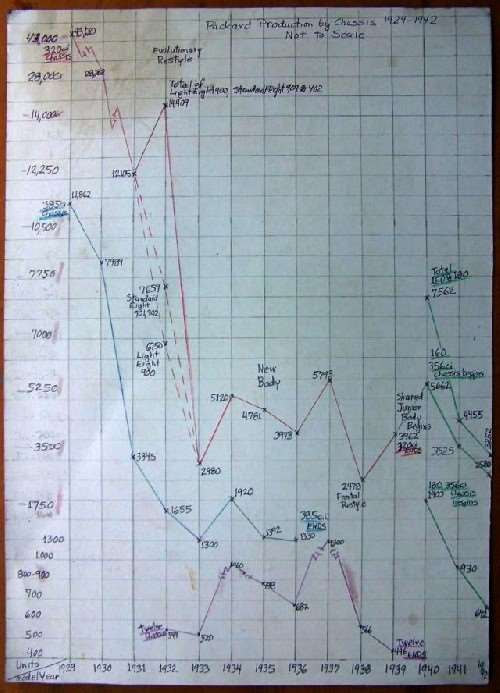
Graph of 1929-42 Production by Engine Type
Posted by 58L8134 On 2014/9/30 20:15:23
Hi
In my ongoing study of how Packard was affected by the Depression, model years and production quantities being to make my head swim. So, here is a quick and dirty graph I drew to make comparisons easier. While it's crude, and not to scale, it works well. Your comments welcome.
The production totals are those found in the Standard Catalog of Independents: The Struggle to Survive Among Giants, Edited by Ron Kowalke, published by Krause.
Steve
Attach file:
 (63.42 KB)
In my ongoing study of how Packard was affected by the Depression, model years and production quantities being to make my head swim. So, here is a quick and dirty graph I drew to make comparisons easier. While it's crude, and not to scale, it works well. Your comments welcome.
The production totals are those found in the Standard Catalog of Independents: The Struggle to Survive Among Giants, Edited by Ron Kowalke, published by Krause.
Steve
Attach file:
(63.42 KB)
This Post was from: https://packardinfo.com/xoops/html/modules/newbb/viewtopic.php?post_id=150673