Owner's Registry vs Production
Posted by Thomas Wilcox On 2011/5/16 14:50:00
Dear All,
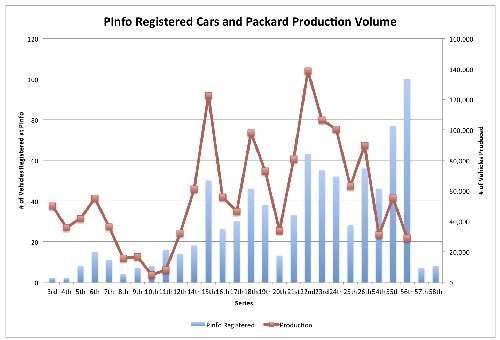
I had previously plotted the owner's registry by year. I have now reproduced this plot by series, which is far more accurate. This also allows me to plot the number of cars produced by Packard on the same graph. A couple of observations:
1) Prior to the 54th series, the number of cars registered at PInfo corresponds remarkably well with the number produced. The exceptions are:
3rd -5th series are under-represented by 55-89%
10th series is over-represented by 310%
11th series is over represented by 400%
17th series is over represented by 60%
26th series is over represented by 56%
54 and 55th series are over represented by approx 250%
56th series is over represented by nearly 800%
2) If the average representation is correct, then .4% of vehicles produced, on average, are registered at PInfo. This analysis excludes the 54-56th series data.
I have attached a pdf of the plot as well as the data file (as an .xls file).
Happy pondering!
Tom
ps. BigKev, if you can have the number of cars registered for a given series/year show up for that search, it would make updating and editing this data much easier.
Attach file:
 (88.39 KB)
 Size: 122.83 KB; Hits: 55
 Size: 69.50 KB; Hits: 47
I had previously plotted the owner's registry by year. I have now reproduced this plot by series, which is far more accurate. This also allows me to plot the number of cars produced by Packard on the same graph. A couple of observations:
1) Prior to the 54th series, the number of cars registered at PInfo corresponds remarkably well with the number produced. The exceptions are:
3rd -5th series are under-represented by 55-89%
10th series is over-represented by 310%
11th series is over represented by 400%
17th series is over represented by 60%
26th series is over represented by 56%
54 and 55th series are over represented by approx 250%
56th series is over represented by nearly 800%
2) If the average representation is correct, then .4% of vehicles produced, on average, are registered at PInfo. This analysis excludes the 54-56th series data.
I have attached a pdf of the plot as well as the data file (as an .xls file).
Happy pondering!
Tom
ps. BigKev, if you can have the number of cars registered for a given series/year show up for that search, it would make updating and editing this data much easier.
Attach file:
(88.39 KB) Size: 122.83 KB; Hits: 55 Size: 69.50 KB; Hits: 47
This Post was from: https://packardinfo.com/xoops/html/modules/newbb/viewtopic.php?post_id=76863